onet2r is an R package for working with O*NET Web Services, archived O*NET database releases, O*NET-SOC taxonomy bridges, BLS OEWS wage and employment context, and reproducible user-supplied occupation measures.
The package is built for analysts who need tidy current-release O*NET data and for researchers who need to ask careful historical questions. O*NET was not designed as a longitudinal panel, so onet2r makes the plumbing visible: archive versions, taxonomy seams, source dates, employment weights, coverage, and provenance.
Installation
You can install the development version from GitHub:
# install.packages("pak")
pak::pak("farach/onet2r")
Authentication
Live O*NET API calls require a free API key from https://services.onetcenter.org/developer/. Store it in .Renviron:
ONET_API_KEY=your-api-key-here
The archive, OEWS, and measure examples below run without a key.
Read Archived Releases
archive_base <- system.file("extdata", "onet-mini", package = "onet2r")
archives <- c(
  `24.3` = file.path(archive_base, "db_24_3_text"),
  `25.1` = file.path(archive_base, "db_25_1_text")
)
release_dates <- c(`24.3` = "2020-08-01", `25.1` = "2020-11-01")

abilities <- onet_panel(
  "Abilities",
  versions = c("24.3", "25.1"),
  scale = "IM",
  archives = archives,
  release_dates = release_dates
)

abilities |>
  select(release_version, onet_soc_code, soc_code, element_name, data_value) |>
  head(6) |>
  onet_kable()
| 24.3 |
15-1132.00 |
15-1132 |
Oral Comprehension |
4.20 |
| 24.3 |
15-1132.00 |
15-1132 |
Problem Sensitivity |
4.40 |
| 24.3 |
29-1141.00 |
29-1141 |
Oral Comprehension |
4.60 |
| 25.1 |
15-1252.00 |
15-1252 |
Oral Comprehension |
4.48 |
| 25.1 |
15-1253.00 |
15-1253 |
Oral Comprehension |
4.30 |
| 25.1 |
29-1141.00 |
29-1141 |
Oral Comprehension |
4.66 |
O*NET-SOC remains at the native 8-digit detail level in onet_soc_code. The 6-digit soc_code exists for labor-market joins.
Reconcile Historical Change
bridge_2010_2019 <- tibble::tibble(
  from_vintage = "2010",
  to_vintage = "2019",
  from_onet_soc_code = c("15-1132.00", "15-1132.00", "29-1141.00"),
  to_onet_soc_code = c("15-1252.00", "15-1253.00", "29-1141.00"),
  map_type = c("split", "split", "one_to_one"),
  crosswalk_weight = c(0.5, 0.5, 1)
)

changes <- onet_panel_reconcile(
  abilities,
  bridge = bridge_2010_2019
)

changes |>
  select(
    from_onet_soc_code,
    to_onet_soc_code,
    element_name,
    from_value,
    to_value,
    value_change,
    change_type,
    safely_comparable
  ) |>
  arrange(desc(abs(value_change))) |>
  head(8) |>
  onet_kable()
| 15-1132.00 |
15-1252.00 |
Oral Comprehension |
4.2 |
4.48 |
0.28 |
transition_data |
FALSE |
| 15-1132.00 |
15-1253.00 |
Oral Comprehension |
4.2 |
4.30 |
0.10 |
transition_data |
FALSE |
| 29-1141.00 |
29-1141.00 |
Oral Comprehension |
4.6 |
4.66 |
0.06 |
real_update |
TRUE |
| 15-1132.00 |
15-1252.00 |
Problem Sensitivity |
4.4 |
NA |
NA |
dropped |
FALSE |
| 15-1132.00 |
15-1253.00 |
Problem Sensitivity |
4.4 |
NA |
NA |
dropped |
FALSE |
change_counts <- changes |>
  count(change_type, name = "rows") |>
  arrange(desc(rows))

ggplot2::ggplot(change_counts, ggplot2::aes(
  x = stats::reorder(change_type, rows),
  y = rows,
  fill = change_type
)) +
  ggplot2::geom_col(width = 0.65, show.legend = FALSE) +
  ggplot2::coord_flip() +
  onet2r_discrete_fill() +
  ggplot2::labs(
    title = "Cross-Vintage Rows Need Reconciliation",
    subtitle = "The bundled fixture crosses a 2010-to-2019 O*NET-SOC seam.",
    x = NULL,
    y = "Rows"
  ) +
  onet2r_theme()
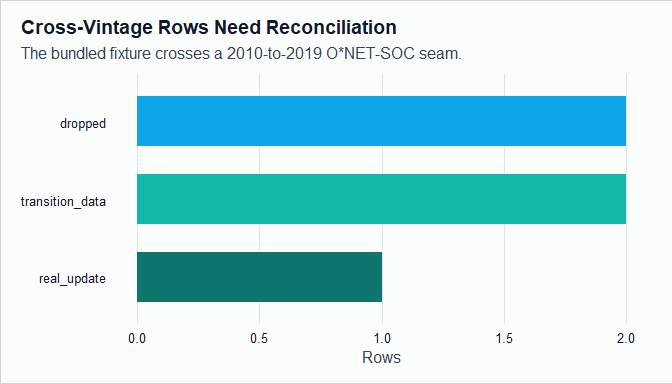
Rows marked as transition data, suppressed estimates, new content, or dropped content are visible in change_type. They are not counted as safely comparable updates.
Bring Your Own Measure
The package does not ship an AI exposure score or any other substantive measure. You supply a score, and onet2r validates keys, performs mechanical rollups, adds weights, and records provenance.
tasks <- onet_archive_read(
  "30.3",
  "Task Statements",
  path = file.path(archive_base, "db_30_3_text"),
  release_date = "2026-05-01"
)
task_ratings <- onet_archive_read(
  "30.3",
  "Task Ratings",
  path = file.path(archive_base, "db_30_3_text"),
  release_date = "2026-05-01"
)

task_scores <- tibble::tibble(
  task_id = c("1001", "1002", "2001"),
  score = c(0.80, 0.40, 0.20)
)

measure <- onet_measure(
  task_scores,
  key = "task_id",
  score = "score",
  key_type = "task",
  universe = tasks$task_id,
  measure_id = "stylized_task_score"
)

onet_coverage(measure) |>
  onet_kable()
occupation_scores <- onet_task_to_occupation(
  measure,
  task_ratings = task_ratings,
  task_metadata = tasks,
  include_supplemental = FALSE
)

occupation_scores |>
  onet_kable()
| 15-1252.00 |
1 |
95 |
0.8 |
15-1252 |
| 29-1141.00 |
1 |
98 |
0.2 |
29-1141 |
Add Employment Weights
| 11-1011 |
2024 |
211230 |
0.040 |
OEWS |
2018 SOC |
2018 SOC |
| 15-1252 |
2024 |
1847900 |
0.353 |
OEWS |
2018 SOC |
2018 SOC |
| 29-1141 |
2024 |
3175400 |
0.607 |
OEWS |
2018 SOC |
2018 SOC |
aggregate <- onet_measure_aggregate(
  occupation_scores,
  weights,
  measure_id = "stylized_task_score"
)

aggregate |>
  select(-coverage, -provenance) |>
  onet_kable()
| stylized_task_score |
0.421 |
5234530 |
5023300 |
0.96 |
2 |
2 |
| stylized_task_score |
OEWS |
2024 |
2018 SOC |
2018 SOC |
FALSE |
2018 SOC -> 2018 SOC |
Stress Test the Plumbing
pums_weights <- onet_weight_panel_pums(
  tibble::tibble(
    SOCP = c("151252", "151252", "291141", "291141"),
    PWGTP = c(80, 120, 200, 80)
  ),
  year = 2022
)

sensitivity <- onet_measure_sensitivity(
  measure,
  weight_panels = list(oews = weights, pums = pums_weights),
  task_ratings = task_ratings,
  task_metadata = tasks,
  include_supplemental = c(FALSE, TRUE)
)

sensitivity |>
  select(
    scenario,
    aggregate,
    employment_coverage_share,
    movement,
    movement_percent
  ) |>
  onet_kable()
| RT_core / task_release / oews / no_bridge |
0.421 |
0.96 |
0.000 |
0.000 |
| RT_core / task_release / pums / no_bridge |
0.450 |
1.00 |
0.029 |
0.070 |
| RT_core_plus_supplemental / task_release / oews / no_bridge |
0.373 |
0.96 |
-0.047 |
-0.112 |
| RT_core_plus_supplemental / task_release / pums / no_bridge |
0.396 |
1.00 |
-0.024 |
-0.058 |
Decompose Aggregate Change
from_scores <- tibble::tibble(
  reference_soc_code = c("15-1252", "29-1141"),
  measure_score = c(1.0, 2.0),
  safely_comparable = c(TRUE, FALSE)
)
to_scores <- tibble::tibble(
  reference_soc_code = c("15-1252", "29-1141"),
  measure_score = c(2.0, 2.5),
  safely_comparable = c(TRUE, FALSE)
)
from_weights <- tibble::tibble(
  reference_soc_code = c("15-1252", "29-1141"),
  employment = c(100, 100)
)
to_weights <- tibble::tibble(
  reference_soc_code = c("15-1252", "29-1141"),
  employment = c(150, 50)
)

decomp <- onet_decompose_change(from_scores, to_scores, from_weights, to_weights)

decomp |>
  select(component, value) |>
  onet_kable()
| within |
0.500 |
| between |
-0.250 |
| interaction |
0.125 |
| unclassifiable |
0.250 |
| total_change |
0.625 |
Main Function Groups
- Current O*NET API data:
onet_search(), onet_occupation(), onet_skills(), onet_tasks(), onet_table().
- Archived O*NET data:
onet_releases(), onet_archive_download(), onet_archive_read(), onet_panel(), onet_panel_reconcile().
- Wage and employment context:
onet_oews_national(), onet_weight_panel_oews(), onet_weight_panel_pums().
- User-measure plumbing:
onet_measure(), onet_task_to_occupation(), onet_measure_aggregate(), onet_measure_sensitivity(), onet_provenance(), onet_coverage(), onet_decompose_change().