Reproducible User Measures
Source:vignettes/measure-reproducibility.Rmd
measure-reproducibility.RmdO*NET users often arrive with their own score: an exposure measure, a
task classification, a skill index, or a hand-coded construct.
onet2r does not try to decide which score is correct. It
helps with the parts around the score: checking keys, using versioned
O*NET files, aggregating tasks to occupations, adding employment
weights, and recording enough provenance for someone else to reproduce
the number.
This article uses the small archive fixtures shipped with the package. The task score is stylized and should not be interpreted as a real exposure measure. Every displayed table is produced by package functions.
Read Task Files from a Pinned Release
tasks <- onet_archive_read(
  "30.3",
  "Task Statements",
  path = archive_dir,
  release_date = "2026-05-01"
)
task_ratings <- onet_archive_read(
  "30.3",
  "Task Ratings",
  path = archive_dir,
  release_date = "2026-05-01"
)

tasks |>
  select(onet_soc_code, task_id, task_type, task) |>
  head() |>
onet_kable()| onet_soc_code | task_id | task_type | task |
|---|---|---|---|
| 15-1252.00 | 1001 | Core | Analyze user needs and software requirements. |
| 15-1252.00 | 1002 | Supplemental | Prepare reports on software testing status. |
| 29-1141.00 | 2001 | Core | Monitor patient health and record signs. |
Task Statements carries task ids and Core or
Supplemental labels. Task Ratings carries relevance and
importance ratings used to aggregate task-level scores.
task_ratings |>
  select(onet_soc_code, task_id, scale_id, scale_name, data_value, recommend_suppress) |>
  head() |>
onet_kable()| onet_soc_code | task_id | scale_id | scale_name | data_value | recommend_suppress |
|---|---|---|---|---|---|
| 15-1252.00 | 1001 | RT | Relevance of Task | 95.0 | N |
| 15-1252.00 | 1001 | IM | Importance | 4.5 | N |
| 15-1252.00 | 1002 | RT | Relevance of Task | 45.0 | N |
| 29-1141.00 | 2001 | RT | Relevance of Task | 98.0 | N |
| 29-1141.00 | 2001 | IM | Importance | 4.8 | N |
Validate a User-Supplied Measure
Here the user brings a 3-task score. It could come from a model, a survey, or manual coding. The constructor checks that the task ids match the selected O*NET release universe.
task_scores <- tibble::tibble(
  task_id = c("1001", "1002", "2001"),
  score = c(0.80, 0.40, 0.20)
)

measure <- onet_measure(
  task_scores,
  key = "task_id",
  score = "score",
  key_type = "task",
  universe = tasks$task_id,
  measure_id = "stylized_task_score",
  measure_name = "Stylized task score",
  release_version = "30.3"
)

onet_coverage(measure) |>
onet_kable()| key_type | n_input | n_universe | n_matched | coverage_share | employment_coverage_share |
|---|---|---|---|---|---|
| task | 3 | 3 | 3 | 1 | NA |
The object also stores unmatched keys explicitly.
unmatched <- if (nrow(measure$unmatched) == 0) {
  tibble::tibble(status = "No unmatched task ids")
} else {
  measure$unmatched
}

unmatched |>
onet_kable()| status |
|---|
| No unmatched task ids |
Roll Tasks to Occupations
The next step is mechanical. We use O*NET task relevance ratings as weights and restrict the calculation to Core tasks.
occupation_scores <- onet_task_to_occupation(
  measure,
  task_ratings = task_ratings,
  task_metadata = tasks,
  weight_scale = "RT",
  include_supplemental = FALSE
)

occupation_scores |>
onet_kable()| onet_soc_code | n_tasks | total_task_weight | measure_score | soc_code |
|---|---|---|---|---|
| 15-1252.00 | 1 | 95 | 0.8 | 15-1252 |
| 29-1141.00 | 1 | 98 | 0.2 | 29-1141 |
Changing the Core-only rule is a plumbing choice, not a change to the user’s score. It belongs in provenance and sensitivity checks.
occupation_scores_all <- onet_task_to_occupation(
  measure,
  task_ratings = task_ratings,
  task_metadata = tasks,
  weight_scale = "RT",
  include_supplemental = TRUE
)

occupation_scores_all |>
onet_kable()| onet_soc_code | n_tasks | total_task_weight | measure_score | soc_code |
|---|---|---|---|---|
| 15-1252.00 | 2 | 140 | 0.671 | 15-1252 |
| 29-1141.00 | 1 | 98 | 0.200 | 29-1141 |
Add Employment Weights
OEWS files are SOC-level. The weight helper makes the source vintage explicit and returns a single shape used downstream.
oews_sample <- onet_oews_national(
  path = system.file("extdata", "oews-national-sample.csv", package = "onet2r")
)

weights <- onet_weight_panel_oews(oews_sample, year = 2024)

weights |>
onet_kable()| reference_soc_code | year | employment | weight_share | source | source_taxonomy | reference_taxonomy |
|---|---|---|---|---|---|---|
| 11-1011 | 2024 | 211230 | 0.040 | OEWS | 2018 SOC | 2018 SOC |
| 15-1252 | 2024 | 1847900 | 0.353 | OEWS | 2018 SOC | 2018 SOC |
| 29-1141 | 2024 | 3175400 | 0.607 | OEWS | 2018 SOC | 2018 SOC |
Aggregate and Inspect Provenance
national <- onet_measure_aggregate(
  occupation_scores,
  weights,
  measure_id = "stylized_task_score"
)

national |>
  select(-coverage, -provenance) |>
onet_kable()| measure_id | aggregate | total_employment | covered_employment | employment_coverage_share | n_occupations | n_reference_soc |
|---|---|---|---|---|---|---|
| stylized_task_score | 0.421 | 5234530 | 5023300 | 0.96 | 2 | 2 |
onet_provenance(national) |>
onet_kable()| measure_id | weight_source | weight_year | source_taxonomy | reference_taxonomy | bridge_used | crosswalk_path |
|---|---|---|---|---|---|---|
| stylized_task_score | OEWS | 2024 | 2018 SOC | 2018 SOC | FALSE | 2018 SOC -> 2018 SOC |
Check Sensitivity to Plumbing Choices
diagnostic <- onet_measure_sensitivity(
  measure,
  weight_panels = weights,
  task_ratings = task_ratings,
  task_metadata = tasks,
  include_supplemental = c(FALSE, TRUE)
)

diagnostic |>
  select(scenario, aggregate, employment_coverage_share, movement, movement_percent) |>
onet_kable()| scenario | aggregate | employment_coverage_share | movement | movement_percent |
|---|---|---|---|---|
| RT_core / task_release / weights / no_bridge | 0.421 | 0.96 | 0.000 | 0.000 |
| RT_core_plus_supplemental / task_release / weights / no_bridge | 0.373 | 0.96 | -0.047 | -0.112 |
plot_diagnostic <- diagnostic |>
  mutate(
    rule = if_else(
      include_supplemental,
      "Core + supplemental tasks",
      "Core tasks only"
    )
  )

ggplot2::ggplot(plot_diagnostic, ggplot2::aes(
  x = aggregate,
  y = stats::reorder(rule, aggregate)
)) +
  ggplot2::geom_vline(
    xintercept = plot_diagnostic$baseline_aggregate[[1]],
    color = onet2r_colors[["slate"]],
    linetype = "dashed"
  ) +
  ggplot2::geom_segment(
    ggplot2::aes(x = 0, xend = aggregate, yend = rule),
    color = onet2r_colors[["light_gray"]],
    linewidth = 1.1
  ) +
  ggplot2::geom_point(color = onet2r_colors[["teal"]], size = 4) +
  ggplot2::geom_text(
    ggplot2::aes(label = sprintf("%.3f", aggregate)),
    hjust = -0.3,
    size = 3.5,
    color = onet2r_colors[["ink"]]
  ) +
  ggplot2::scale_x_continuous(
    expand = ggplot2::expansion(mult = c(0, 0.18))
  ) +
  ggplot2::labs(
    title = "Task handling moves the headline number",
    subtitle = "Same task score, two rollup rules. The dashed line is the baseline.",
    x = "Aggregate score",
    y = NULL
  ) +
  onet2r_theme()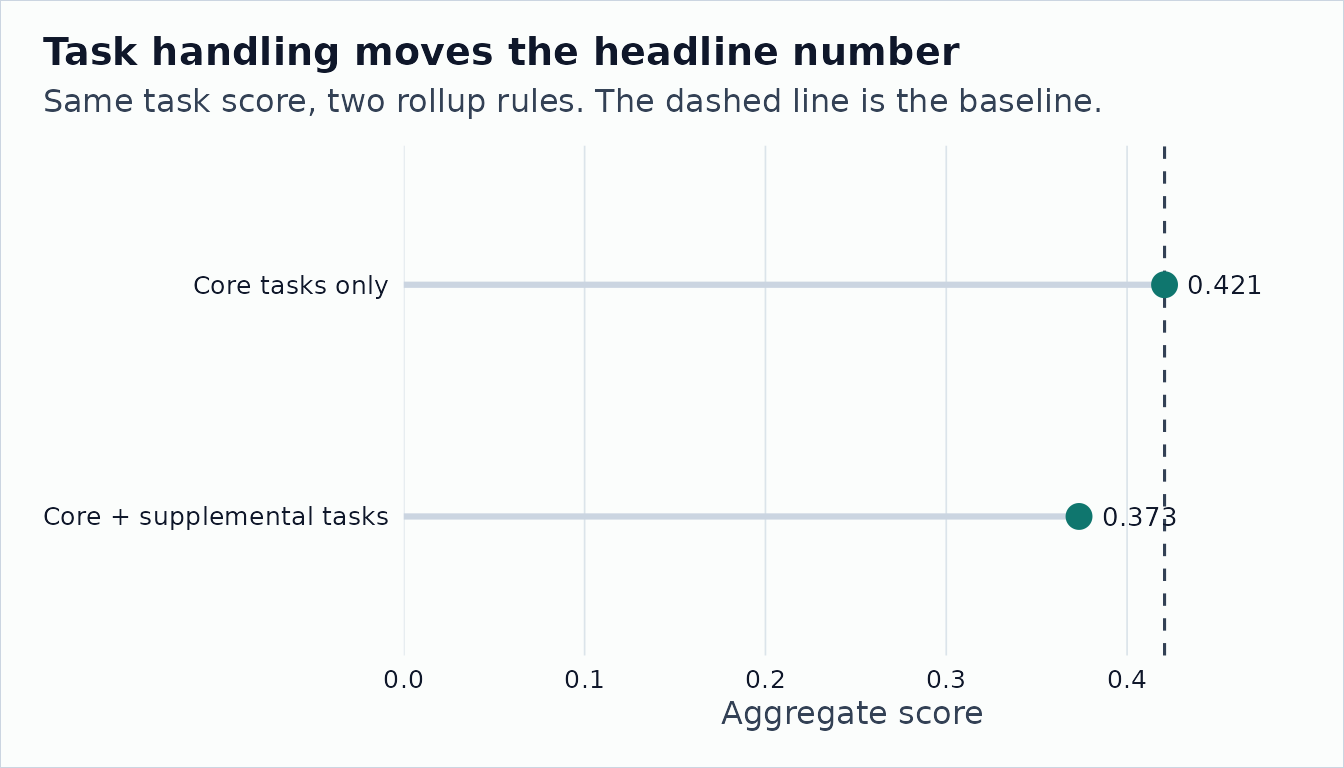
The diagnostic will not tell you which task score is right. It reports how far the headline number moves when non-substantive plumbing changes.